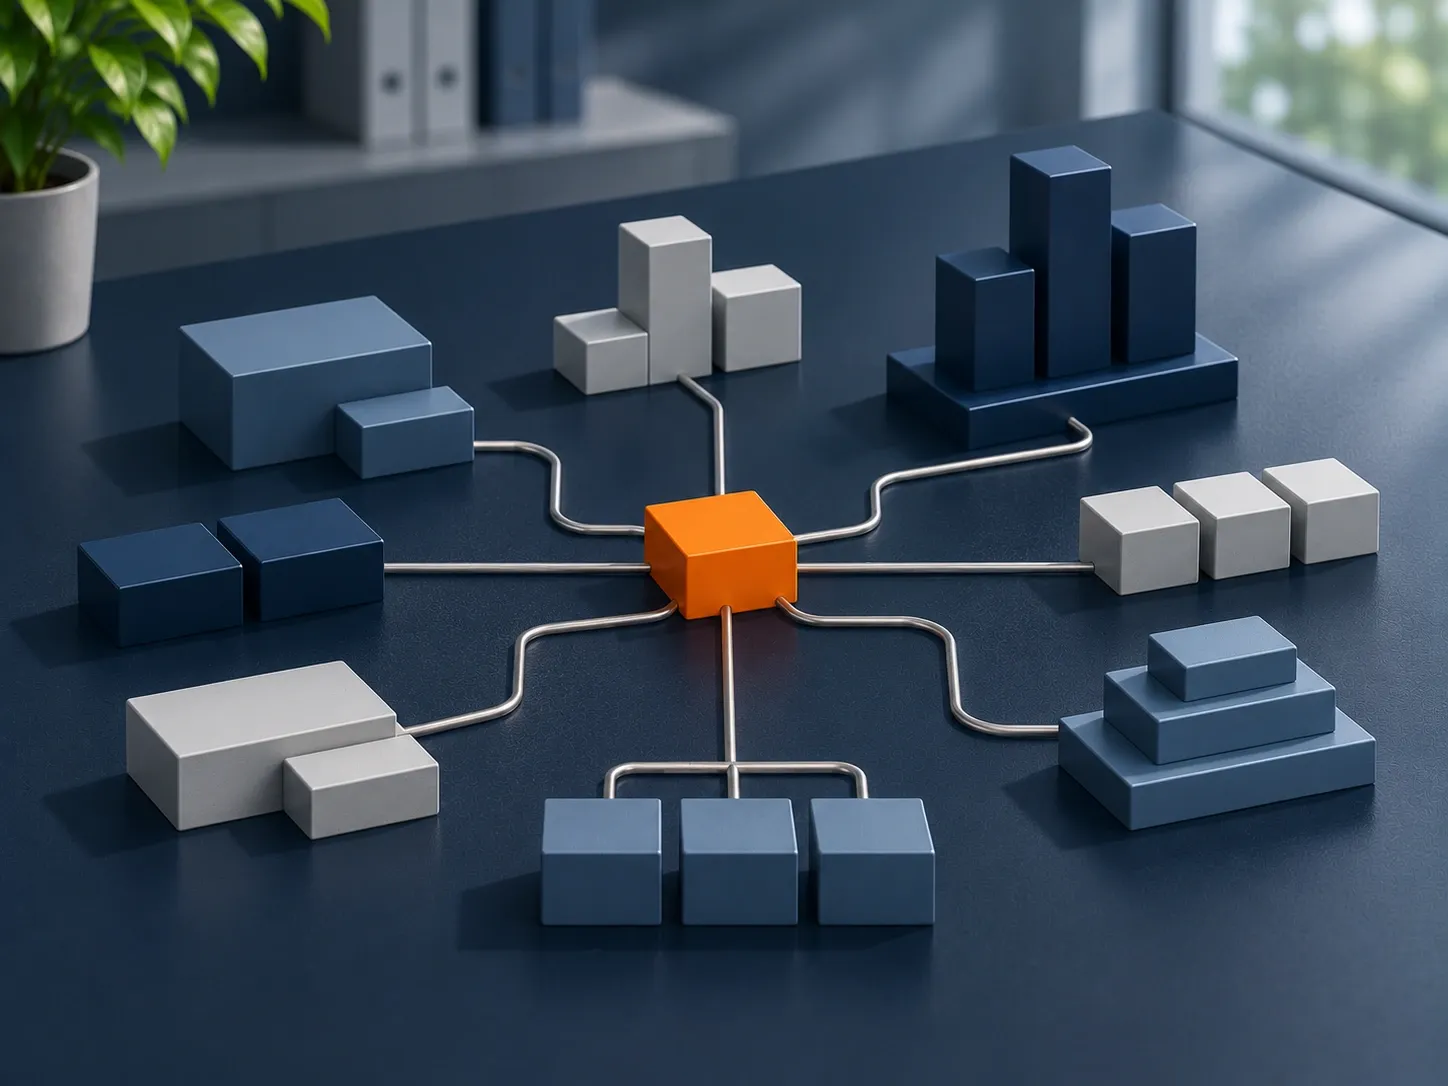
IT landscape
An IT landscape that has grown piece by piece over the years often holds back your growth.
Read more about IT landscape

Technology and dataData
You have more data than ever, but you do not always know what to steer by. Figures contradict each other or say little about your strategy. The Next Organization starts small: first a few reliable figures that show whether your direction is working, then the larger projects.
Good management information starts with the question of what your strategy needs to deliver. Only then do you look at data and dashboards. That way you avoid a dashboard full of figures nobody needs. We start with little data: the basic information you use every day. Without good input there is no good output, so making it reliable comes first. It takes four steps, each building on the one before.
Step 1
What it delivers
A handful of figures that show whether your strategy is working, each with its own owner
Step 2
What it delivers
One place for the right information, with agreements on definitions and quality
Step 3
What it delivers
An overview for each audience, built in short rounds with the people who will use it
Step 4
What it delivers
A fixed rhythm in which you measure, discuss and adjust
Measure, discuss, adjust
Little data first, big data later. Only once your basic information is right do larger data and AI projects make sense. And we link every KPI to a meeting where someone acts on it.
Whether your figures are right depends on systems that share information. That is what IT landscape is about. The financial side of steering is covered under Financial analysis.
You get one set of KPIs that fits your strategy, with a single version of the truth. The board and teams see in good time where they need to adjust. Your meetings are about choices rather than about which figure is right. And reliable data lays the foundation for AI.
With little data: the few pieces of basic information you work with every day, such as customers, orders and hours. Make sure they are right and kept in one place. Without good input there is no good output, not even with AI. The larger projects come after that.
Figures that show whether you are reaching your strategic goals, not just revenue. Choose a few figures per goal, such as margin per customer group or customer satisfaction. Combine figures on results with figures that look ahead.
Fewer than you think. For the board, a limited set of KPIs often works well. Teams steer by a few figures of their own that link to those.
For each figure, agree what it means, where it comes from and who manages it. Take the data from one source instead of separate spreadsheets. That way every department talks about the same number.
That depends on your systems and on who will use it. Many organisations choose a standard package that connects to their existing software. Clear definitions and reliable data matter more than the tool.
Expertise
Strategy affects everything. These themes are closely connected.
An IT landscape that has grown piece by piece over the years often holds back your growth.
Read more about IT landscape
Book a no-obligation sparring session. We will think through your challenge with you and show how we would tackle it together.